Today, we're revealing the secrets of our simulation engine, a sophisticated mathematical model that powers all our predictions, from title races to relegation battles across Europe's top leagues.
The Foundation: ELO Ratings
Everything starts with ELO ratings, which is a system originally designed for chess but perfectly adapted for football. Think of ELO as a team's "power level" - a single number that captures their current strength based on all their historical performances.Unlike simple league tables that only show recent results, ELO ratings consider:
- The strength of opponents faced
- The margin of victory
- Home advantage
- Historical performance trends
Every match updates these ratings: beat a strong team, and your rating jumps significantly. Lose to a weaker side, and it drops accordingly. This creates a dynamic measure of team quality that forms the foundation of our predictions.
Simulating Individual Matches: The Poisson Magic
Here's where the mathematics gets interesting: to predict a match between Team A and Team B we simulate the actual scoreline.Our system uses the ELO difference between teams to calculate expected goals using something called a Poisson distribution. This mathematical model is particularly suited to football because:
- Goals are relatively rare events
- They occur independently
- The average number of goals per match is fairly consistent
For example, if Liverpool plays Aston Villa, the current 170-point difference suggests Liverpool should score about 1.8 goals on average, while Aston Villa 1.2. But football isn't played on spreadsheets - our model then randomly generates actual scores based on these probabilities.
Sometimes Liverpool wins 3-0, sometimes it's a 1-1 draw, occasionally Aston Villa pulls off a 2-1 upset. The beauty lies in capturing this uncertainty mathematically.
The Power of 100,000 Simulations
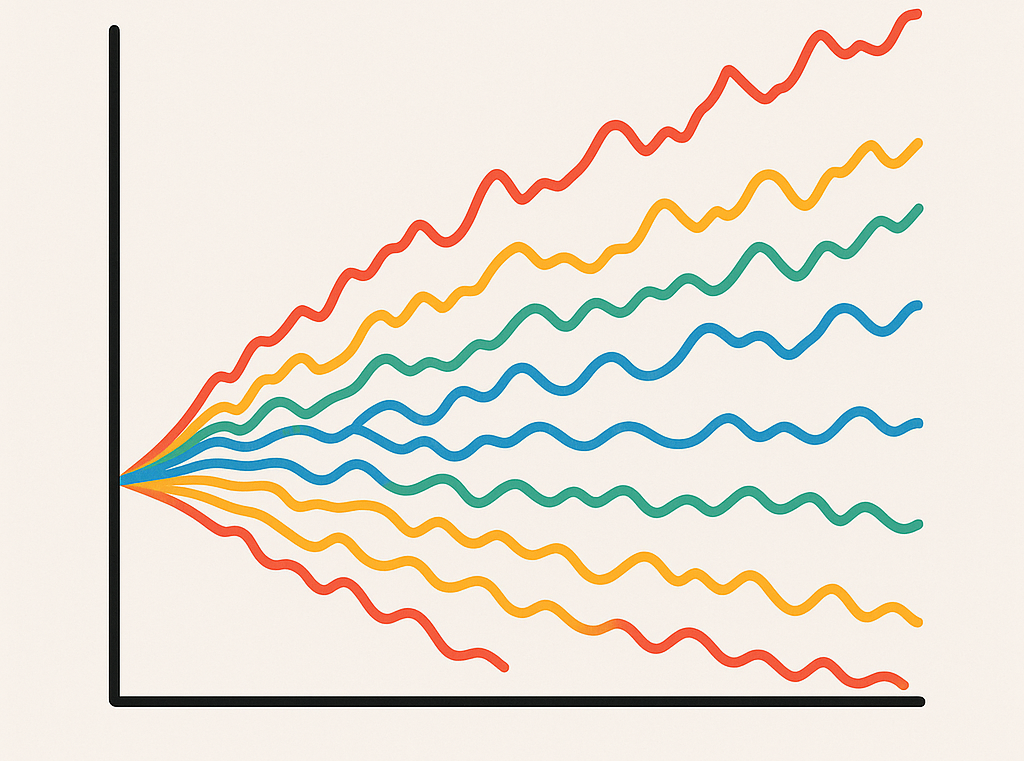
One match simulation tells us little, so we run 100,000 simulations of each match of an entire season. This is called the Monte Carlo method - named after the famous casino because it uses controlled randomness to solve complex problems. For each simulation:1. We simulate every remaining match in the season
2. Update the league table based on results
3. Record final positions, points totals, and achievements
After 100,000 complete seasons, patterns emerge:
- Arsenal finished 1st in 34,400 simulations → 34.4% championship probability
- Liverpool reached top-4 in 81,200 simulations → 81.2% top-4 probability
- Sunderland finished 18th or below in 84,500 simulations → 84.5% relegation risk
When you see our league prediction tables, you're looking at the culmination of millions of individual calculations:
Position Probabilities: These show how often each team finished in specific positions across all simulations. A 31.3% championship probability means Liverpool won the title in about 31,300 of our 100,000 simulated seasons.
Average Position: This is the mathematical average of all finishing positions. Even if a team never actually finishes 4.7th, this number tells us they typically finish between 4th and 5th place.
ELO Rankings: Our separate ELO charts show current team strength regardless of league position. A team might be 10th in their league but have a higher ELO than teams at the top of weaker leagues.
Moreover, our simulation engine constantly evolves. We regularly:
- Update ELO ratings after every match
- Refine our goal-scoring models
- Incorporate new data sources
- Validate predictions against real outcomes
The Human Element: The Flairs of this Method
Our models are sophisticated, but football remains beautifully unpredictable. We can't account for many decisive factors such as injuries to key players or transfer window impacts.What our simulations excel at is capturing the underlying probabilities based on current team strength. Think of them as weather forecasts for football - incredibly useful for understanding likely outcomes, but never guaranteeing exactly what will happen.
Beyond Entertainment: Real-World Applications
While our predictions entertain football fans, the underlying technology has serious applications:- Clubs use similar models for transfer valuations
- Broadcasters rely on them for scheduling decisions
- Betting companies build entire business models around these probabilities
- Fantasy football players use our data for strategic advantages
Want to dive deeper? Check out our simulation tables.